Project Timeline vs Gantt Chart: The Same Plan Drawn Both Ways
People use "project timeline" and "Gantt chart" as if they were the same thing, and often they get asked for interchangeably. They are not the same, and picking the wrong one is how you end up showing a client a wall of bars or showing a team a plan with no detail. The quickest way to see the difference is to draw one plan both ways.
The plan is a small office relocation that runs from Monday 21 September to Friday 6 November.
The timeline version
That is a project timeline: a line with dated events on it. You can read it in about five seconds. The project starts on 21 September, the layout is approved on 8 October, the office is ready on 27 October, it is operational on 30 October, and everything finishes on 6 November.
What it is good at is telling a story to someone who needs the headline. What it cannot tell you is anything about the work between the dots.
The Gantt version
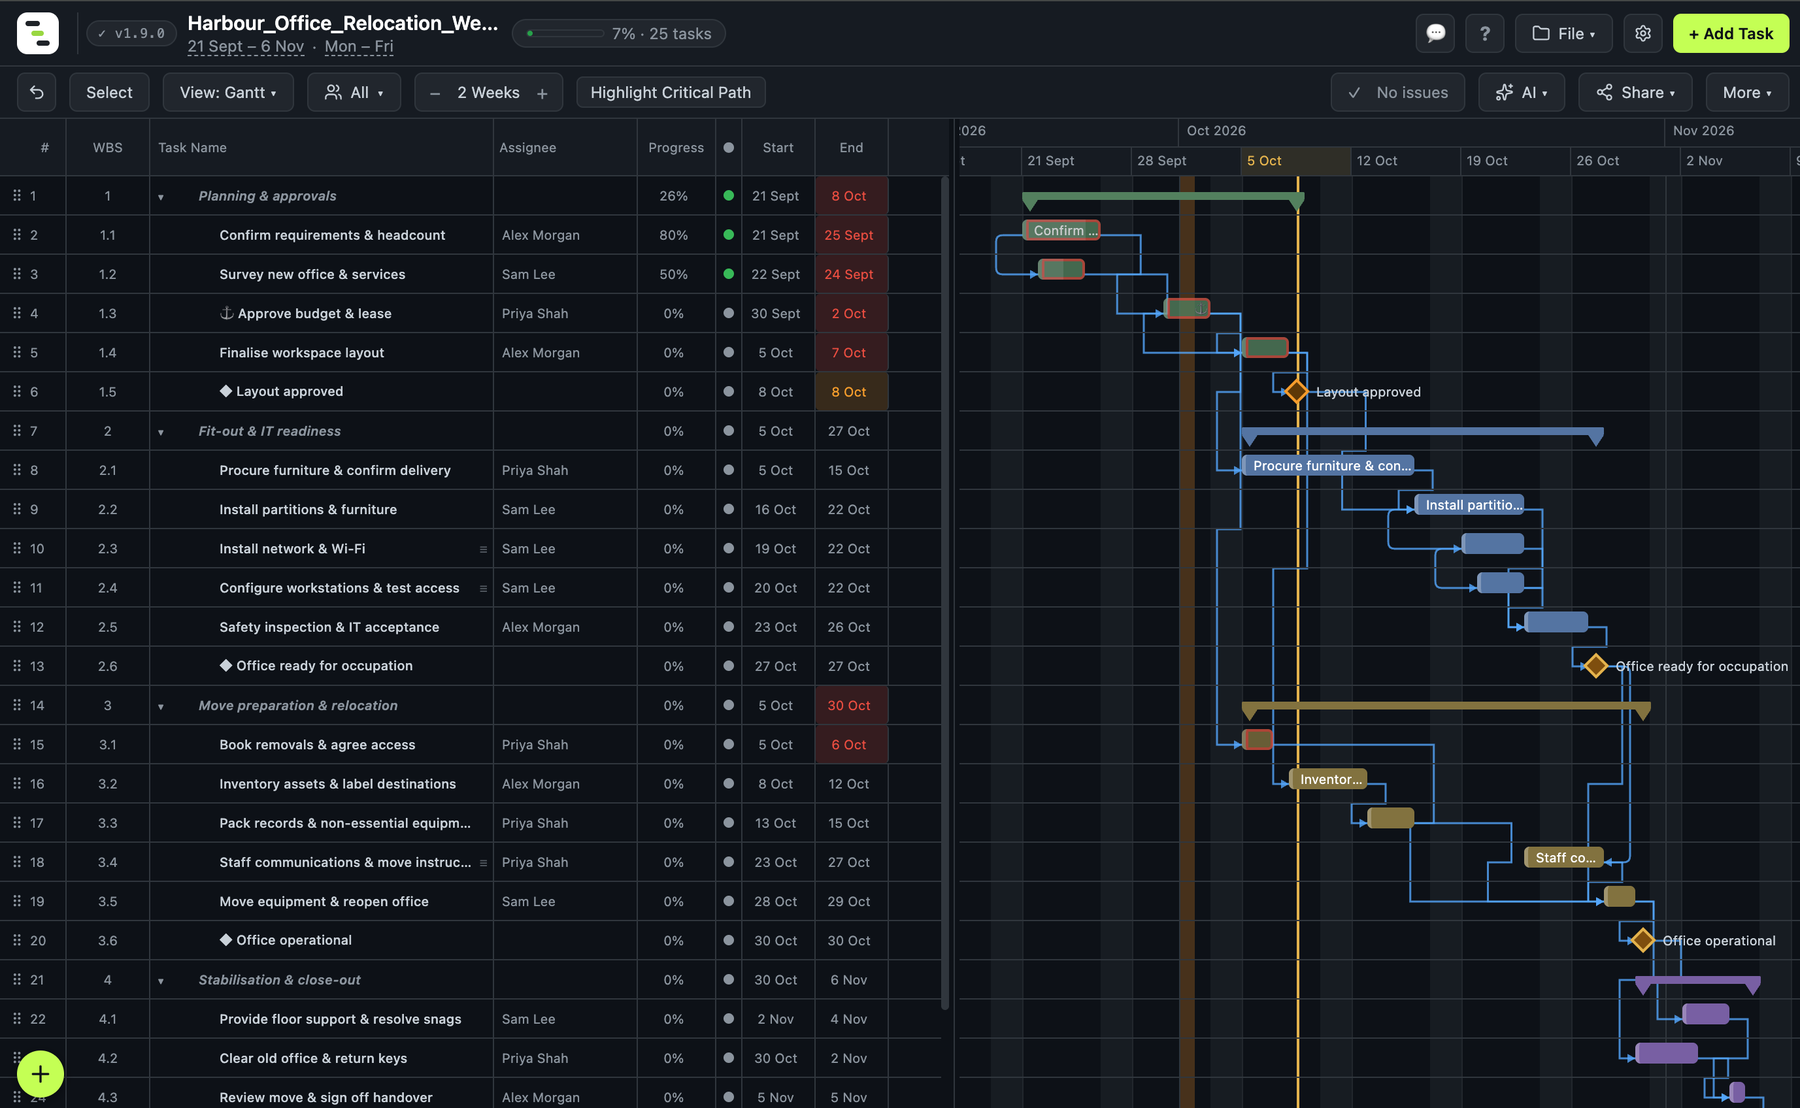
Same plan, same dates. The milestones are still there as diamonds, but now you can also see:
- Duration. Furniture procurement runs for nine working days, from Monday 5 October to Thursday 15 October. On the timeline it does not exist.
- Overlap. Booking removals, finalising the layout and procuring furniture all start on the same Monday, 5 October. Three streams of work are running at once.
- Dependencies. The arrows show that installation waits for the furniture and that the office-ready milestone waits for the inspection. Move one and the others move, as this before and after shows.
- Owners. Three people, with several tasks each, and a stretch in the week of 19 October where one person is on three overlapping tasks.
Side by side
| Project timeline | Gantt chart | |
|---|---|---|
| Shows | Key dates and milestones | Every task as a bar with start, end and duration |
| Dependencies | No | Yes, drawn as links |
| Overlap and parallel work | No | Yes |
| Who owns what | Rarely | Yes, per task |
| Effort to read | Seconds | A minute or two |
| Effort to maintain | Low | Higher, but dates can follow the links |
| Good for | Executives, clients, a status slide | The team doing the work, the person running the plan |
Which one should you use?
Use a timeline when the question is "when are the big moments?" and the audience does not need to know how you get there. Use a Gantt chart when the question is "what has to happen, in what order, and who is doing it?" or "what moves if this slips?"
In practice you rarely need to choose, because the timeline is a summary of the Gantt chart. If you keep the working plan as a Gantt chart with milestones marked, the timeline is just the milestones lifted out. In Gantto you can also collapse each phase to a single summary bar, which gives you a coarse view of the same plan without a second document to keep in step. If you build the timeline separately in a slide, you now have two things to update, and they will disagree within a week.
Going the other way
A timeline cannot grow into a plan. If you start with a handful of dates and later need to know what depends on what, you are drawing a Gantt chart whether you wanted to or not. Starting from tasks and milestones costs a little more up front. How to create a project plan walks through building this exact plan, and how to create a Gantt chart covers the basics in Gantto.
If you need to send the plan to someone who does not use Gantto, PNG and PDF export are part of the Solo licence. The free version covers building and editing the plan.
Related reading: How to Create a Gantt Chart · What happens when one task slips · Project templates
Build the plan in Gantto and switch between the big picture and the detail of the work.